IUCN/SSC Otter Specialist Group Bulletin

|
©IUCN/SCC Otter Specialist Group Volume 29 Issue 1 Pages 1 - 67 (January 2012) Citation: Doroff, A., Badjeros, O., Corbell, K., Jenski, D. and Beaver, M. (2012). Assessment of Sea Otter (Enhydra lutris kenyoni) Diet in Kachemak Bay, Alaska (2008-2010). IUCN Otter Spec. Group Bull. 29 (1): 15 - 23 Assessment of Sea Otter (Enhydra lutris kenyoni) Diet in Kachemak Bay, Alaska (2008-2010) Angela Doroff1, Oriana Badajos1, Karen Corbell2, Dana Jenski3 and Melanie Beaver4
1Kachemak Bay Research Reserve, 95 Sterling Highway, Suite 2, Homer, AK 99603, USA |

   |
| (Received 18th December 2010, accepted 2nd January 2012) |
| Abstract: Long-term monitoring of a keystone species’ diet contributes to our understanding of shifts in the structure of an ecosystem. Sea otters were extirpated from Kachemak Bay, Alaska by 1911 and returned to the region through natural recolonization beginning in the 1970s. The sea otter population increased from <1,000 in the 1990s to 3,600 in 2008. In Kachemak Bay we describe the diet based on results from scat analyses and visual observation. Scat collection is only feasible in winter months and analysis is biased toward species where hard parts of prey are ingested. Scats were collected over a one-week period October - May during 2008-10. Dominant prey types for all samples combined were mussel (41%), crab (32%), and clam (12%). The combined proportion of these prey observed visually were clam (38%), mussel (14%) and crab (2%). Scat analysis will be a useful tool in identifying trends in winter consumption of crab and mussel, but will exclude identification of larger bivalve and soft-bodied prey. Kachemak Bay is primarily a soft-sediment benthic habitat, which is suitable habitat for clams and crabs. In the 1970s, commercially valuable crab and clam species were abundant in this area. We evaluate scat analysis as a low-cost tool to monitor long-term trends in the winter diet for sea otters in Kachemak Bay. |
| Keywords: Alaska; Enhydra lutris; habitat; prey choice; scat |
| Française | Español |
INTRODUCTION
Sea otters eat a wide range of marine invertebrates and their diet varies by the type of forage habitat available to them. The relationship between sea otter foraging and ecosystem structure has been best studied in habitats, which are urchin and kelp dominated (Estes and Palmisano, 1974; Simenstad et al., 1978; Duggins, 1980). Less is understood about prey and ecosystem dynamics in soft-sediment habitats where dominant prey tend to be clams and crab (Kvitek and Oliver, 1988; Kvitek et al., 1992; Doroff and DeGange, 1994). Sea otters were extirpated from Kachemak Bay, Alaska by the 1900s and were naturally recolonizing the area by the mid 1970s (Schneider, 1976). Kachemak Bay is primarily a soft-sediment basin with extreme tidal ranges (8.7m) in south central Alaska (KBNERR, 2001). By 2008, the sea otter population in Kachemak Bay increased from <1,000 in the 1990s to 3,600 (Gill et al.,2009). Methods for assessing sea otter diet include visual observation (Doroff and DeGange, 1994), scat analysis (Doroff and Bodkin 1994; Watt et al., 2000), and recently emerging techniques in whisker isotope analysis (Newsome et al., 2009; Newsome et al., 2010). All methods have some biases in identification of sea otter prey. In this pilot study we assess sea otter prey types through scat analyses and visual observations and evaluate scat analysis as a low-cost tool to monitor long-term trends in the winter diet for sea otters in Kachemak Bay.
MATERIALS AND METHODS
Scat Collection
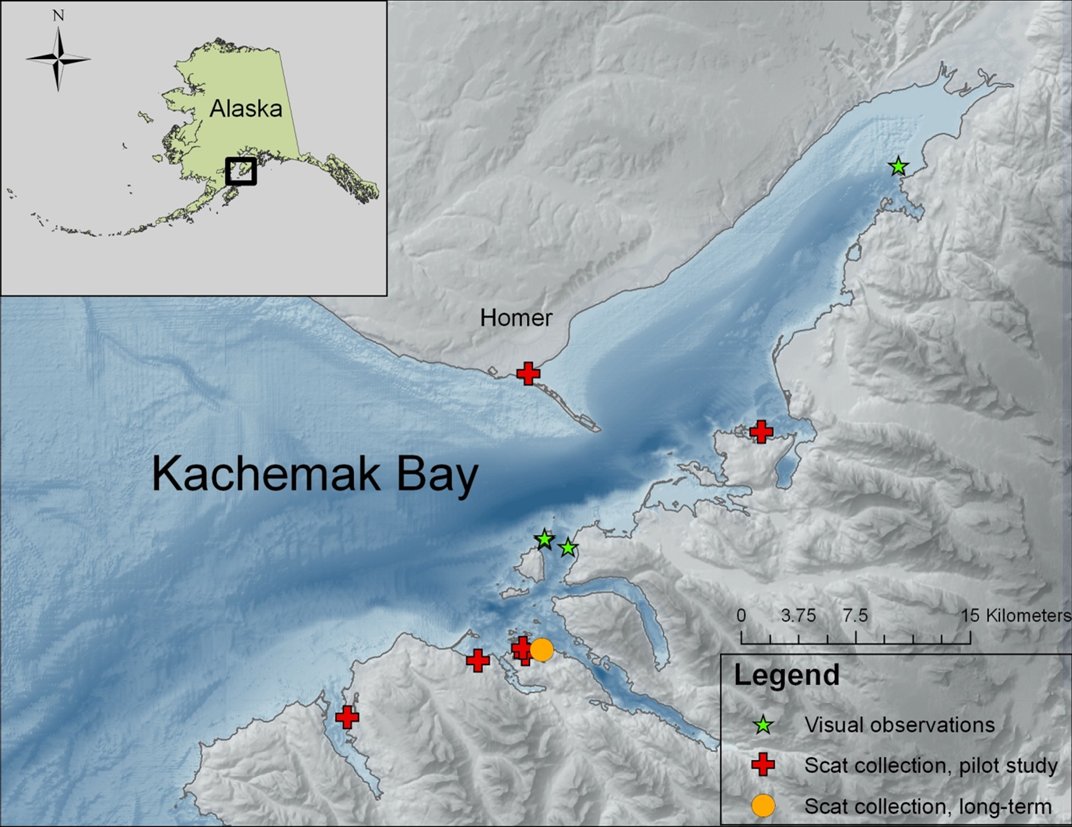
Scat collection is limited in our study area to the winter months when sea otters haul-out more frequently and in greater concentrations (Doroff and Badajos, 2010; Doroff, pers. obs.). In March 2008, we began a pilot study to assess the feasibility of determining sea otter diet by scat collection in Kachemak Bay. Nine locations were assessed, and of those, a site in Little Tutka Bay where sea otters (females, females with pups, and an occasionally territorial male, Christen pers.com) haul-out on floating docks was selected as a long-term monitoring location (Fig. 1).
The site in Little Tutka Bay was chosen because we could reliably visit the site throughout the winter months on a weekly basis. In Little Tutka Bay, both sea otter and river otter (Lontra canadensis) scats were collected (Fig. 2). River otter scats were easily distinguished from sea otter scats by content (95-100% fish bones versus primarily invertebrate remains) and location (river otter scat tended to be, but not exclusively, on the highest point on the floating platform (such as rope coils)). During August – May 2008, 2009, and 2010, we searched for and collected scat samples from one-week accumulations at approximately monthly intervals (Table 1). All scats were collected, labeled with the date and location, and frozen until processing.
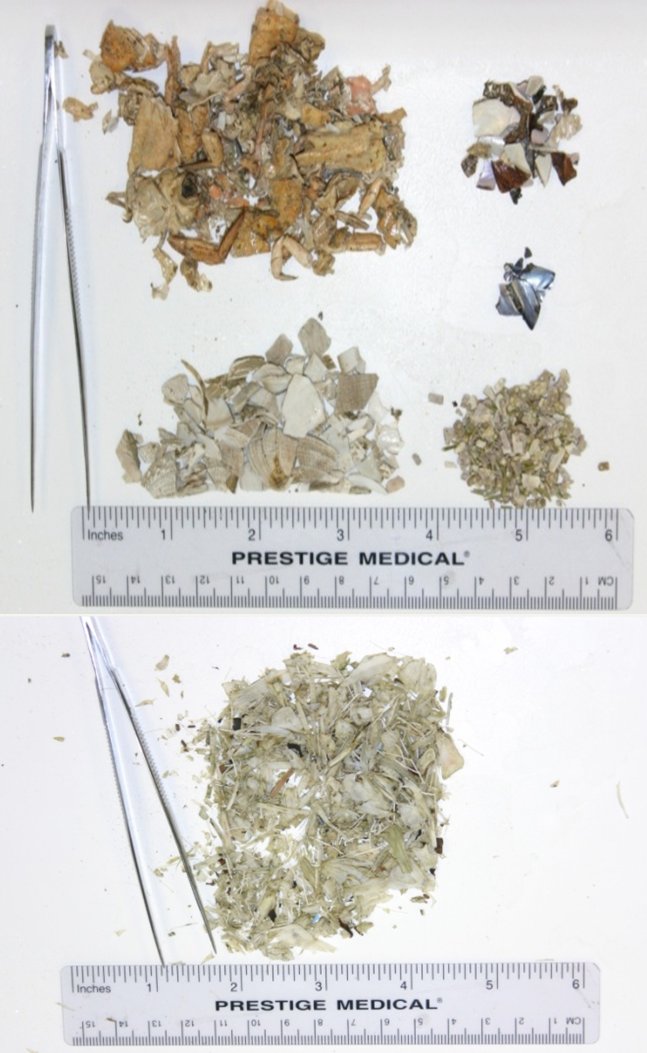 |
| Figure 2. Washed, dried, and sorted sea otter and river otter scats collected in Kachemak Bay, Alaska.(click for larger version) |
| Table 1: Sample sizes for scat collected from sea otter and river otter in Kachemak Bay, Alaska. Typically, sea otters only haul out at these sites during the winter months. A dashed line indicates that the study site was not checked during that month. | ||||||||
| 2008 | 2009 | 2010 | ||||||
| Month | Sea Otter | River Otter | Sea Otter | River Otter | Sea Otter | River Otter | ||
| Jan | -- | -- | -- | -- | 6 | 0 | ||
| Feb | -- | -- | 9 | 0 | 3 | 0 | ||
| Mar | 24 | 0 | 8 | 0 | 2 | 0 | ||
| Apr | 55 | 5 | 10 | 0 | 1 | 0 | ||
| May1 | 68 | 3 | 32 | 0 | 0 | 0 | ||
| Jun | -- | -- | 0 | 0 | 0 | 0 | ||
| Jul | -- | -- | 0 | 0 | 0 | 0 | ||
| Aug | 0 | 9 | 0 | 0 | ||||
| Sept | 0 | 4 | 0 | 0 | ||||
| Oct | 18 | 9 | 0 | 0 | ||||
| Nov | -- | -- | -- | -- | ||||
| Dec | 20 | 1 | 8 | 0 | ||||
| 1sample size in May 2008 reflects an increased effort across multiple sites in Kachemak Bay. This was done as a pilot to assess the feasibility of the project. | ||||||||
Scat Sample Processing
Methods followed Watt et al. (2000). Scat samples were washed with fresh water through a high-pressure hose using one large mesh (2mm) and one fine screen (≤1mm) sieve. Air-dried samples were sorted by hand to the nearest discernable taxonomic level and placed in Ziploc baggies for analysis (Fig. 2). The relative importance of each prey type was determined by the frequency of occurrence and the percent volume for each sample. The frequency of occurrence was expressed as the presence of a prey type in a scat. The percent volume of each prey type was estimated and ranked as follows, using a 1-6 index method where: 1=<5%, 2=5-25%, 3=26-50%, 4=51-75%, 5=76-95%, 6=>95%. We ranked each prey type, which occurred in the scat. To summarize mean percent volume, we used the median value of each category.
Visual Observations
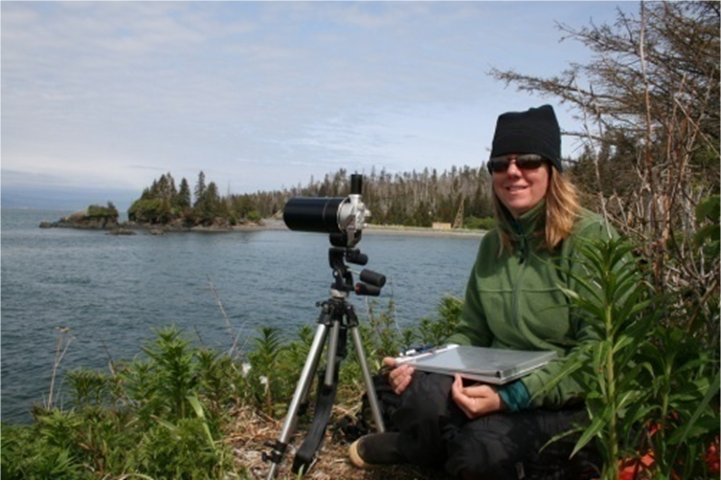
We conducted visual observations in a female/pup area in proximity to the long-term monitoring site for scat collection during summer 2008 (Fig. 1). Lack of funding precluded the collection of visual observations of foraging sea otters during the winter months. Focal animal sampling was used to select study animals and all visual observations were conducted with a high-power telescope (Questar field model 50x). Methods followed previously established protocols for visually identifying prey and estimating prey size (Doroff and DeGange, 1994; Doroff and Bodkin, 1994).
RESULTS AND DISCUSSION
During 2008 (March, April, and May), we collected 147 sea otter scat samples from 9locations throughout the Bay. During October 2008 - May 2009 and December 2009 - April 2010, we collected 97 and 20 scat samples, respectively, at our long-term monitoring site in Little Tutka Bay (Fig. 1).
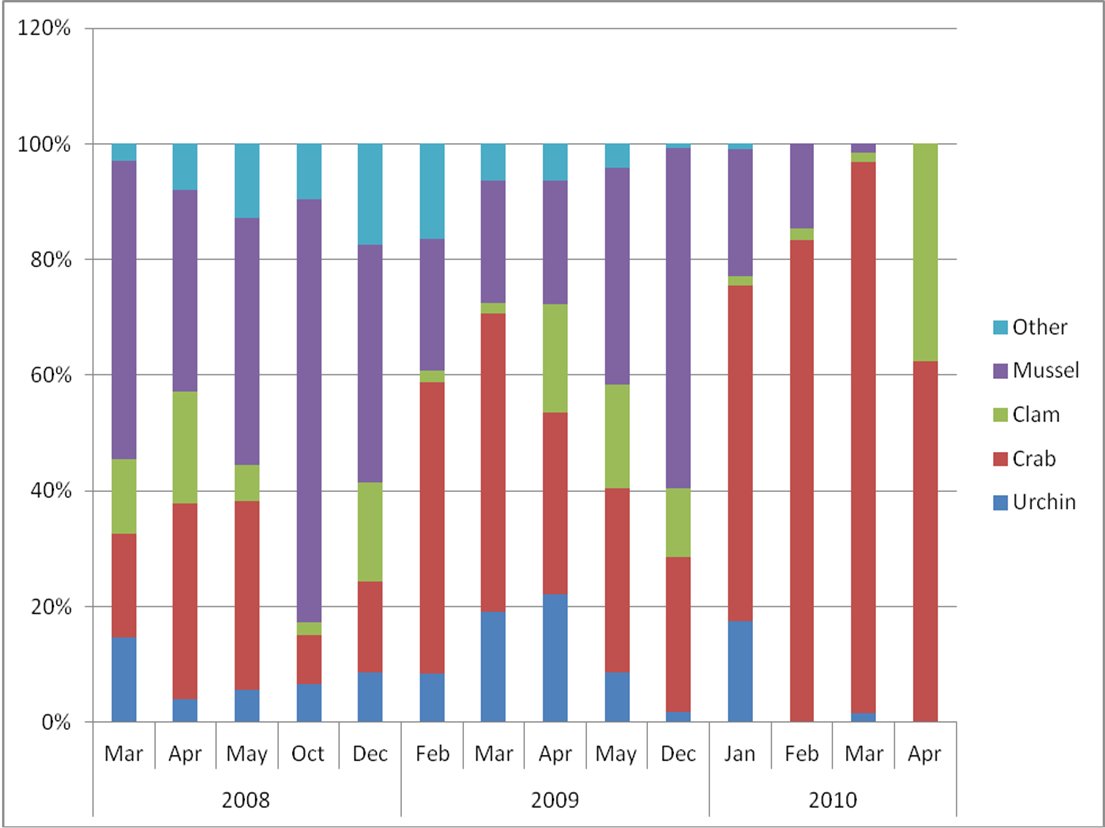
Dominant prey types in the scat samples at all sites were mussel (Mytilus trossulus) (41%), crab (32%) (including: Cancer spp., Telmessus cheiragonus, Pagurus spp. and probable Chionoecetes bairdi), and clam (12%) (including: Saxidomus giganteus, Mya spp., and Leucoma staminea). Other species present throughout the sampling period included urchins (Strongylocentrotus spp.), chitons, limpets (Tectura spp.), and snails (Table 2). In most cases, the prey was well masticated and we were not able to identify the remains to species. Though not previously known to be sea otter prey in Kachemak Bay, we found fish bones in scat collected during the winter sampling periods in 2008 and 2009. Fish bones were usually only one or two rib bones and never a whole fish; fish bones comprised <1% of the total volume of any single scat (Table 2). Sea otter haul-out sites in our study area were shared with river otters (Lontra canadensis), so it is possible that the fish bones could have been originally part of the river otter scat. Regardless of species, scat samples on the surface of the dock tended to be discrete samples. However, with multiple sea otters and other species using the dock space, cross contamination of scat is possible. The river otter scat collected has not been analyzed for species content to date. We also collected 10 scats that were of unknown origin and we were not able to identify species by visual assessment; possible species include American mink (Neovison vison) and bear (Ursus americanus). River otter and unidentified scats were omitted from summaries of sea otter prey.
The mean number of prey types per scat sample across all locations and sample periods was 4 (n= 264; range 1-10). Trends in relative composition and prey diversity (number of taxon per scat) were similar among sites sampled in spring 2008 and the long-term monitoring site sampled in winters 2008-2009 and 2009-2010. In general, there was an inverse relationship between proportion of mussel and crab in the diet. There could be multiple reasons for the observed pattern. Contributing factors include small sample sizes (especially in 2010), the seasonality of rough water and its effect on sea otter forage patterns (confining foraging to more protected near-shore waters where mussels are found), and the age of the animals using the haul out site (independent young of the year may forage on mussels more often than adults). To better document the sex-age classes of sea otters using the haul out site, we place a low-coast Plant-Cam™ on the dock during the spring 2010 monitoring period. We had no luck in capturing images of sea otters on the dock and it appeared all haul out activity occurred only at night during that time period. Proportions of clam, urchin, and other prey in the scat samples fluctuated but remained at low levels (≤20%) throughout the sampling period (Fig. 3).
We assessed prey by visual observation in 2008 (n=322 successful dives) and the dominant prey types identified in sea otter diet were clam (38%), mussel (14%), and crab (2%). Size classes were estimated visually for 230 clams retrieved as sea otter prey and the median size class consumed ranged between 3 and 5cm; shells were discarded rather than ingested. Based on visual observation, shells from most clams consumed would not have been in the scat record for foraging sea otters. Mussels were a much smaller part of the diet and were consumed by all sex and age classes of sea otters. In general, mussels are easy for sea otters to capture but are a lower-calorie prey per food item than larger bivalves. As a result, young-of-the-year tend to have a higher portion of mussels in their diet than adults (Doroff and Bodkin, 1994). From a scat analysis viewpoint, mussel shells are ingested every time they are foraged on and will be identifiable in the scat sample whereas clams will only be detected when the smallest size classes or clam species with soft shells (such as Mya spp.) are consumed.
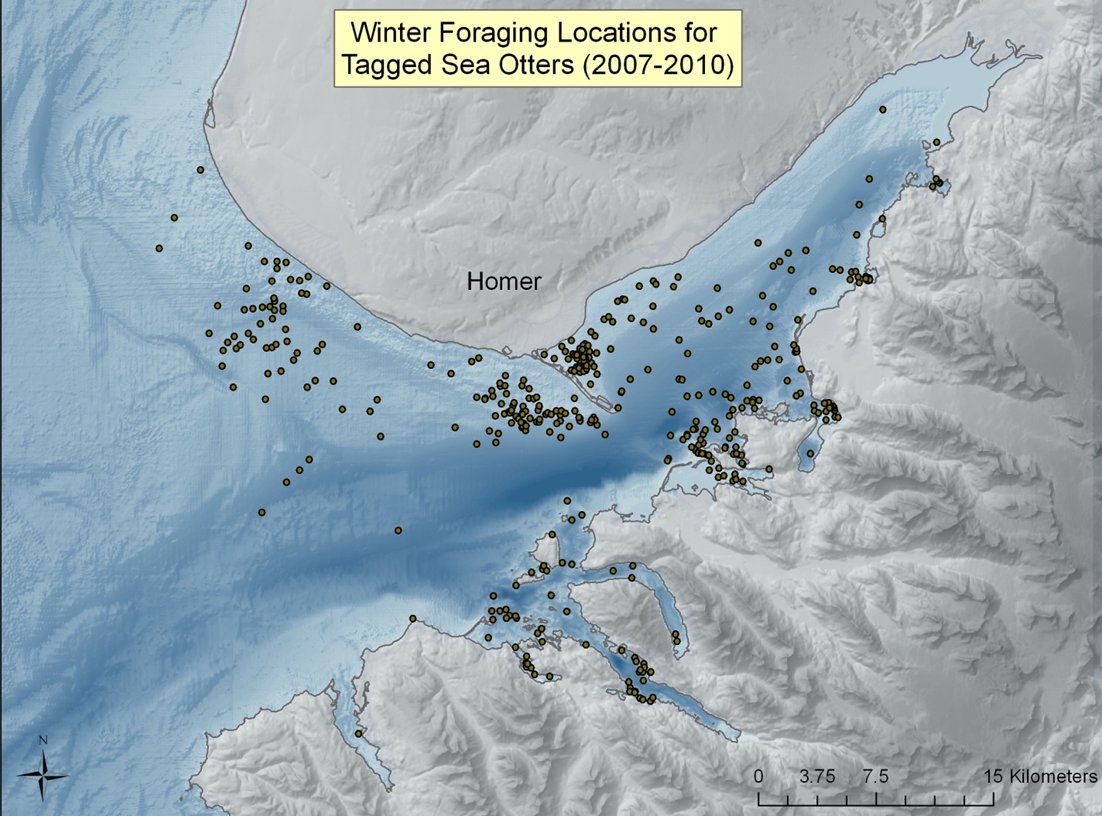
Kachemak Bay is a large fjord estuary and supports the only significant commercial and recreational clam fisheries in Southcentral Alaska, as well as a personal-use Tanner crab (Chionoecetes bairdi) fishery. The habitat is largely soft-sediment and has the potential to support large populations of high-calorie sea otter prey, such as clams and crabs (KBNERR 2001). During 2007-2010, the U. S. Fish and Wildlife Service and the Kachemak Bay Research Reserve conducted a study of survival, movements, and habitat use of 44 radio-marked sea otters in Kachemak Bay (Doroff and Badajos 2010). Figure 4 illustrates the cumulative distribution of winter (Oct-Apr) foraging locations for all sex and age classes of study animals. We assumed that marked animals were representative of the whole population and foraging occurred near haul-out sites as well as in open water during our scat-sampling period. To begin to understand relationships between sea otter foraging and the benthic ecosystem in Kachemak Bay, multiple methods will need to be employed. Scat analysis is strongly biased toward ingested hard parts of prey and, in the case of clams, understates the contribution of larger sized clams in the diet. In contrast, visual observations are limited to the near-shore foraging habitat and are biased against prey consumed >1km from shore, which may include larger species of crab. Because of biases in both visual observation methods and in scat analyses to accurately determine sea otter diet, emerging techniques in isotope studies of sea otter whiskers will likely be an important tool in understanding diet in habitats like Kachemak Bay (Newsome et al. 2009, Newsome et al. 2010).
Evaluation of scat analysis
Scat analysis will be a useful tool to identify trends in specific prey, such as crab, in Kachemak Bay over time. Crab parts, even those that are well-masticated, are identifiable in the scat samples and include a range of species from small intertidal and subtidal species to larger Tanner crabs. We are developing an identification manual for the crab species, which occur in Kachemak Bay sea otter scats collected during the winter months. Identifying crab to species in sea otter scat would allow students to monitor trends in crab species consumed over time, both within a season and among years. Human use of crab in the study area is managed by the Alaska Department of Fish and Game. A better understanding of the effects of both human use and of a keystone species foraging on crab populations will facilitate comprehensive management of harvestable crab species.
Acknowledgements - We would like to thank Dave Seaman for his years of volunteering to look for, collect, label, and deliver sea otter scats; we would have no long-term trend site to monitor without his good-humored assistance. We thank Greg and Sandra Christen for allowing the dock at their home to be utilized as a long-term monitoring site. We would like to thank all of the volunteers who collected and sorted sea otter scats in 2008, 2009, and 2010: Kristin Worman, Myfanwy Rowlands, Ingrid Harrald assisted with sorting and Bob Hartley, Karen Shemet, Steve Baird, and Weatherly Bates assisted with sample collection in 2008. We particularly we thank Debbie Tobin and her students for their interest and help with the project. The Kachemak Bay Research Reserve supported the project by supplying freezer and lab space. We thank Carmen Field who provided assistance in prey identification. We thank Carmen Field, Amy Alderfer, Kim Donohue, and Steve Baird and one anonymous reviewer for review and comments. We thank Verena Gill and Doug Burn at the U.S. Fish and Wildlife Service for financial support on the project.
REFERENCES
Doroff, A.M., Bodkin, J.L. (1994). Sea otter foraging behavior and hydrocarbon levels in prey. pp 193-208 In: Loughlin, T.R. (ed.) Marine Mammals and the Exxon Valdez. Academic Press.
Doroff, A.M., DeGange, A.R. (1994). Sea otter, Enhydra lutris, prey composition and foraging success in the Northern Kodiak Archipelago. Fishery Bulletin 92: 704-710.
Doroff A.M., Badajos, O. (2010). Monitoring survival and movement patterns of sea otters (Enhydra lutris kenyoni) in Kachemak Bay, Alaska, August 2007-April 2010: Final Report. Kachemak Bay Research Reserve, 95 Sterling Highway Suite 2, Homer, Alaska. 18pp.
Duggins, D.O. (1980). Kelp beds and sea otters: an experimental approach. Ecology 61(3): 447-453.
Estes, J.A., Palmisano, J.F. (1974). Sea otter: their role in structuring nearshore communities. Science 185: 1058-1060.
Gill, V.A., Doroff, A.M., Burn, D.M. (2009). Aerial surveys of sea otters (Enhydra lutris) in Kachemak Bay, Alaska 2008. Internal report. U.S. Fish and Wildlife Service, Marine Mammals Management, 1011 E. Tudor Road, Anchorage, Alaska. 21pp.
Kachemak Bay Research Reserve (KBNERR) and National Oceanic and Atmospheric Administration, Coastal Services Center. (2001). Kachemak Bay Ecological Characterization. CD-ROM. NOAA/CSC/20017-CD. Charleston, SC: NOAA Coastal Services Center.
Kvitek, R.G., Oliver, J.S. (1988). Sea otter foraging habits and effects on prey populations and communities in soft-bottom environments. pp 22-47. In: VanBlaricom G.R., Estes, J.A. (eds.) The Community Ecology of Sea Otters. Springer-Verlag, Berlin, West Germany.
Kvitek, R.G., Oliver, J.S., DeGange, A.R., Anderson, B.S. (1992). Changes in Alaskan soft-bottom prey communities along a gradient in sea otter predation. Ecology 73(2): 413-428.
Newsome, S.D., Tinker, M.T., Monson, D.H., Oftedal, O.T., Ralls, K., Staedler, M.M., Fogel, M.L., Estes. J.A. (2009). Using stable isotopes to investigate individual diet specialization in California sea otters (Enhydra lutris nereis) Ecology 90(4): 961-974.
Newsome, S.D., Bentall, G.B., Tinker, M.T., Oftedal, O.T., Ralls, K., Fogel, M.L., Estes. J.A. (2010). Variation in d13C and d15N diet-vibrissae trophic discrimination factors in a wild population of California sea otters (Enhydra lutris nereis). Ecological Applications 20 (6): 1744-1752.
Simenstad, C.A., Estes, J.A. Kenyon, K.W. (1978). Aleuts, sea otters, and alternate stable-state communities. Science 200: 403-411.
Schneider, K.B. (1976). Assessment of the distribution and abundance of sea otters along the Kenai Peninsula, Kamishak Bay, and the Kodiak Peninsula. Final Report for the Alaska Department of Fish and Game, Anchorage, AK. 72pp.
Watt, J., Siniff, D.B. Estes, J.A. (2000). Inter-decadal patterns of population and dietary change in sea otters at Amchitka Island, Alaska. Oecologia 124: 289-298
Résumé : Bilan du Regime Alimentaire de la Loutre de Mer (Enhydra lutris kenyoni) dans la Baie de Kachemak, Alaska (2008-2010)
Le suivi à long terme de l'alimentation d’une espèce clé contribue à notre compréhension des changements dans la structure d'un écosystème. Les loutres de mer ont disparu de la Baie de Kachemak en Alaska en 1911 et sont revenues grâce à un début de recolonisation naturelle dans les années 1970. La population de loutres est passée de moins de 1000 individus dans les années 1990 à 3600 en 2008. Dans la Baie de Kachemak nous avons décrit le régime alimentaire des loutres en analysant les épreintes et en cumulant les observations visuelles. La collecte des épreintes n'est possible qu’en hiver et l'analyse est biaisée en faveur des proies dont les parties dures sont ingérées. Les épreintes déposées durant une semaine ont été collectées et ce chaque mois entre octobre et mai pendant la période 2008-2010. Sur l’ensemble des échantillons prélevés, les proies dominantes sont les moules (41%), les crabes (32%), et les palourdes (12%). Pour les observations visuelles, voici l’ordre de consommation: palourdes (38%), moules (14%) et crabes (2%). L'analyse des épreintes est un outil utile pour identifier les tendances hivernales de consommation de crabes et de moules, mais excluent la possibilité d'identifier de grands bivalves et d’autres proies au corps mou. La Baie de Kachemak présente principalement un habitat de sédiments benthiques mous favorable aux palourdes et aux crabes. Dans les années 1970, les crabes et les palourdes de valeur commerciale étaient abondants dans cette région. Nous estimons enfin que l'analyse des épreintes est un outil à faible coût pour surveiller les tendances à long terme de l'alimentation hivernale des loutres de mer dans la Baie de Kachemak.
Revenez au dessus
Resumen: Evaluación de la Dieta de Nutria de Mar (Enhydra lutris kenyoni) en la Bahía de Kachemak, Alaska (2008-2010)
Los monitoreos de largo plazo de dieta de especies clave contribuyen al entendimiento de los cambios de estructura de un ecosistema. Las nutrias de mar fueron extirpadas de la bahía de Kachemak, Alaska en 1911 y volvieron a la región a través de recolonización natural en 1970. La nutria de mar incrementó su población de < 1.000 individuos en 1990 a 3.600 en el 2008. Nosotros describimos la dieta de la bahía de Kachemak basado en los resultados a partir de análisis de heces y observación directa. La colección de heces es únicamente factible en los meses de invierno y su análisis es sesgado hacia especies donde sus partes duras son ingeridas. Las heces se colectaron durante un periodo de una semana durante Octubre a Mayo durante 2008-2010. Los tipos de presas dominantes para todas las muestras combinadas fueron mejillones (41%), cangrejos (32%) y almejas (2%). El análisis de heces sería una herramienta útil para la identificación de tendencias en el consumo de invierno de cangrejos y mejillones, pero excluiría la identificación de grandes bivalvos y presas de cuerpo blando. La bahía de Kachemak es primariamente un hábitat bentónico de sedimento blando, el cual es hábitat disponible para almejas y cangrejos. En 1970, especies de cangrejos y almejas de interés comercias fueron abundantes. Nosotros evaluamos el análisis de heces como una herramienta de bajo costo para el monitoreo a largo plazo de tendencias en la dieta de invierno para las nutrias de mar en la bahía de Kachemak.
Vuelva a la tapa