 |
Last Update:
Thursday November 22, 2018
|
| [Home] |
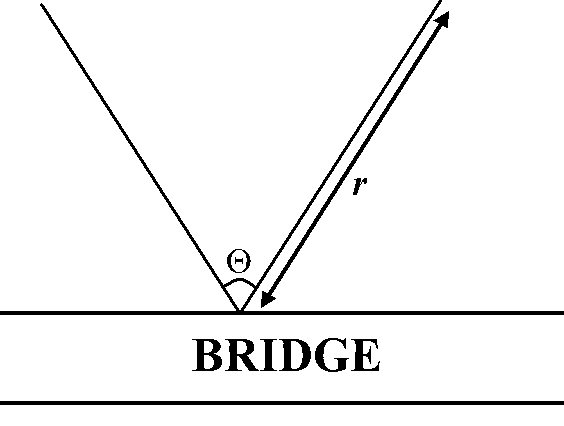
INTRODUCTION Estimating density of wild populations of the Eurasian otter (Lutra lutra) is very difficult, because of its cryptic and mainly nocturnal habits (Mason and Macdonald, 1986, 1987; Kruuk, 1995, 2006; Wilson et al., 1996; Wilson and Delahay, 2001; Chanin, 2003; Long et al., 2008). In the past, therefore, abundance data have been obtained from spraint (otter faeces) numbers or, more roughly, from the number of positive sites, i.e. with spraints and/or tracks, registered during surveys (Mason and Macdonald, 1986, 1987, 2004; Kruuk, 1995, 2006; Reuther et al., 2002; Chanin, 2003; Gruber et al., 2008; Roberts et al., 2008). However, there is an considerable amount of evidences that criticises the use of faeces for this purpose (Kruuk et al., 1986; Kruuk and Conroy, 1987; Kruuk, 1992, 1995, 2006; Reuther et al., 2002; Gallant et al., 2007; Roberts et al., 2008). Criticisms are based on data indicating that the number of spraints produced by an otter varies on a seasonal basis, and sign quantities in a particular place are nor indicative of neither animal abundance nor of activity there (see references above). Recently, Guter et al. (2008) have tried to demonstrate that spraint counts correlated with activity of an otter in a given site, but their results are questionable for several reasons. Gruber et al. (2008) have built a maximum likelihood model to estimate daily activity rates from the presence of aged and/or fresh signs, although this has not been tested yet. Several methods have been developed and tested to accurately measure otter density, using counts from infra-red machines or with DNA-based identification of hairs and spraints (Hung et al., 2004; Waits and Paetkau, 2005; Garcia et al., 2006; Kalz et al., 2006; Prigioni et al., 2006a; Arrendal et al., 2007; Lanszki et al., 2008; Hájková et al., 2008). These methods, although being useful, are expensive and they are likely to have some disadvantages (Chanin, 2003; Waits and Paetkau, 2005; Kruuk, 2006). In coastal environments, Kruuk et al. (1989), and Yoxon (2003), aproximate the number of otters occurring in an area by counting den sites (“holts”), which relate to population size. This is not useful in freshwater ecosystems, as the number of den sites can be misidentified if one does not use radio-tracking (Kruuk et al., 1998). Northern areas of the north hemisphere have snow cover during long times of the year, and snow-tracking is a “standard” method for successfully estimating otter populations (Sidorovich and Macdonald, 2001; Chanin, 2003; Arrendal et al., 2007; Sulkava, 2007; Sulkava and Liukko, 2007; Hájková et al., 2008). It is obvious that the most accurate way for studying otter populations is by using direct observations (Kruuk and Moorhouse, 1991; Kruuk, 1995, 2006; Ruiz-Olmo, 1995; Wilson et al., 1996; Bravo et al., 1998; Ruiz-Olmo et al., 2001; Wilson and Delahay, 2001; Saavedra, 2002; Chanin, 2003). This method requires otters to be active in daylight, and needs individual identification of animals. The occurrence of a certain degree of diurnal activity of the otter in the Mediterranean basin enables censuses from direct, visual observations (Ruiz-Olmo, 1995; Bravo et al., 1998; Ruiz-Olmo et al., 2001; Saavedra, 2002). However, the fact that otters do not have individually distinctive markings in this area (Kruuk, 1995, 2006; but see a possibility in Gilkinson et al., 2007) makes this kind of study more complex, and for the procedure (Ruiz-Olmo, 1995), it is necessary to mobilize a large quantity of resources, and the use of inexperienced volunteers (Bravo et al., 1998), to simultaneously cover the study area. This methodology has produced good estimates of the number of otters in a locality (Ruiz-Olmo, 1995; Bravo et al., 1998; Ruiz-Olmo et al., 2001; Saavedra, 2002), but visibility of the animals may be a problem (Walsh et al., 2009), and a good view of the sampling area is necessary. Often, riparian woodland affects the detection of individuals, but this can be corrected by increasing the number of people taking part in the work. The aim of the present study is to test the effectiveness of this method based on direct observations, but without involving considerable logistic effort. MATERIAL AND METHODS Study areasTo test the adjustment of the design (see Figure 1 below), two sites with quite different environmental attributes were selected in the province of Salamanca (central Spain). In those two areas the climate is continental Mediterranean, with cold and wet winters but warm and dry summers. Both sites show degraded environmental characteristics, as a consequence of uncontrolled human activity. The first area is the Riolobos reservoir, an enclave in the steppe of the province of Salamanca (41º 0’ 24.38’’ N 5º 18’ 12.93’’ W, 833 m.a.s.l., extent: about 0.20 km2; Rouco, 2006). This dam was built in the 90’s and has been used since 2000, being colonized by otters in recent times, in 2005 (Rouco, 2006). The shape of this reservoir is approximately circular, with some peninsulas making the profile somewhat complex. The muddy and sandy shores of Riolobos lack any vegetation cover, with an arid band from the water over three to six meters. Riolobos reservoir is the only area holding permanent water during winter in this area, thus surveys were focused here. Riolobos has been one of the most important areas for aquatic birds in Central Spain and the most important in Salamanca (Rouco, 2006), but because of the management of fisheries in the reservoir by the regional administration, nowadays the Riolobos’ biodiversity has been largely lost (Rouco, 2006). For Eurasian otters, human pressure on the water complexes of the area, nearly all from fishermen, is the key factor limiting the establishment of a population (own data). The second locality is the river Tormes where it runs through the city of Salamanca (40º 57’ 23.25’’ N 5º 39’ 40.59’’ W, 800 m.a.s.l., about 1.49 km2). This is a linear habitat, with banks covered with a thick riparian forest, sometimes rather thin as a consequence of the recreational activities of people in the riverine area. The river is wide, maximally about 400 m, with many islands, and low gradient (< 2 %). Several small tributaries are also present. The river is highly polluted, although this does not appear to affect the occurrence of otters. The presence of otters in these areas is seasonal, restricted to winter and/or fall (Rouco, 2006; García et al., 2009; own data). For more details on these sites see Rouco (2006), García (2008), García and Mateos (2009), and García et al. (2009). Otter surveysThe basic technique consists in the observation of a water surface from an elevated point, with binoculars and telescope, for a given time looking for otter activity. These observations were carried out at dusk and dawn, when it is more likely that otters are active. The basic unit of sampling effort is one hour per observer. In Riolobos, because of its shape and small area, the entire water surface can be monitored from only two points, one on the wall of the dam, and another one an elevated point along the shore (Ruiz-Olmo, 1995; Ruiz-Olmo et al., 2001). From January to February 2009, ten periods of observations were carried out at this site, when the entire surface was monitored simultaneously by the observers. Due to the absence of neighbouring water bodies, the movements of otters seem to be restricted to this site. The river Tormes in Salamanca is different. The lineal structure of the habitat, and the relative high forest cover in some sites, reduces the probabilities of encounters, and the area must be monitored by a larger number of observers. Here, the model (briefly described down here; Rowcliffe et al., 2008) was checked for another objective: to confirm if it is possible to estimate the density of otters from a relatively high number of independent sampling sites, not covering the entire area all at the same time. Fourteen sites were defined for this purpose (mostly on bridges), from which the observations were made, and monitoring was repeated at least three times. Stretches were surveyed from January to February 2009, on days selected randomly. Evidences show that otters also use the available streams in the area, so this habitats were also sampled. Length of the sites surveyed was setted in a minimum of 10 km following the recommendation of Ruiz-Olmo (1995), allowing a representative sample of the population abundance. The number of observations during each period were divided by the units of sampling effort (one hour per observer) for standardizing the results. Independently, the population of otters was estimated, for the dates when the studies were carried out, from two widely used methods and in the same surface sampled through sightings. In Riolobos, as the environmental conditions allow this, animals were censused from direct observations at dawn and daybreak. Additionally, other population size estimate came from mud fresh tracks found in the ten sessions, after carrying out the vigils (esimation by measuring some track parameters and analysed by one-way ANOVA and discriminant analysis; see further details in: Ruiz-Olmo et al., 2001; Saavedra, 2002; Mercier and Fried, 2003; Gusset and Burgener, 2006; García, 2008). In Salamanca, otter population was estimated also from this kind of mud and snow tracking following the same guidelines for analysis. Sampling the same surfaces at the same time with different population size estimation techniques allow for testing the fitness of the methods. RFTC model and estimation of parametersRowcliffe et al. (2008) developed a model (hereafter, RFTC model), that estimates carnivore density from encounter rates of animals by camera traps, and this is potentially suitable for application to otter sightings. An observer with adequate equipment works in a similar way to camera traps, covering a surface of the water body with the shape of a part of a circle, the detection area (Figure 1). Thus, this detection area could be defined by its radius (r) and the angle of observation (Θ) (Figure 1; Rowcliffe et al., 2008). Density with this formula is defined in relationship with the observation rate (number of observations, y, per unit of time effort, t; see down here): D (animals/km2) = y/t π/vr(2 + Θ) being v the velocity of the movements (km/h) of animals during the sampling period. This speed was measured from the observations obtained in the field work, 1.96 km/h in Salamanca and 1.67 km/h in Riolobos. Other available calculations of this parameter (Kruuk, 1995, 2006; Ruiz-Olmo, 1995; Saavedra, 2002; Garcia et al., 2006; Prigioni et al., 2006b) were not employed, given that it varies within the range of the otter, and it is better to use data from the populations studied. This value is easy to obtain from the visual censuses or deriving from parsimonious approximations (Tremblay et al., 2009).
The radius (r) and the angle (Θ) of the detection area were estimated on aerial photographs from the sites. The radius (expressed in kilometers) was defined as the maximum length that can be viewed from a point. As there are two, left and right, radia, both were measured and the mean value used. The effective angle (radians) of detection was calculated from aerial photographs using ImageJ software (http://rsbweb.nih.gov/ij/). If otters were watched during a large time, an independent observation (as defined previously for the model) was considered each 20 minutes (Rowcliffe et al., 2008). The density of otters for Riolobos was independently measured for the ten surveys, and calculated by summing the density obtained by the observers. For Salamanca the design and the analysis were different. As samples were taken at random intervals, both in time and space, the density (otters/km2) was also estimated independently for each of the 14 sites sampled. After that, a mean otter density from this data was calculated (see procedures in the next section), and the population size simply estimated by multiplying this mean density for the total surface studied. Statistical analysis The estimates from direct counts, mud tracking and from the RFTC equation in Riolobos were correlated using the non-parametric Spearman rank (RS). All statistical calculations were carried out with S-PLUS 8.0 and MyStat 12.0. RESULTS The numbers of Eurasian otters inhabiting Salamanca and Riolobos, as estimated, respectively, from tracking and visual census, were two animals for both sites, an abundance of 0.14 and 0.20 otters/km of bank. For the area of Riolobos, the otter density derivated from the RFTC equation compares well with the visual count and mud tracking data, and the correlation is statistically highly significant (Visual counts vs. RFTC model: RS = 0.99, d.f. = 9, P=0.0001; Mud tracking vs. RFTC model: RS = 0.98, d.f. = 9, P=0.0001). The bootstrap density estimates assessed from these methods are similar [expressed in otters/km2; direct census (mean ± SE, 95% CI): 0.40 ± 0.57, lower: 0.00, upper: 0.80; RFTC density (mean ± SE, 95% CI): 0.40 ± 0.56, lower: 0.00, upper: 0.79). For the locality of Salamanca, the mean RFTC bootstrapped estimate for the 14 river stretches sampled was 1.41 ± 0.12 otters/km2 (mean ± SE; 95% CI: lower: 1.33, upper: 1.50 otters/km2), similar to, or perhaps a little higher, than the value from tracking, nearly 1.34 otters/km2. The overall population size in Salamanca was 1.92 from the RTFC model and two otters from tracks.
DISCUSSION The results presented here appear to confirm that the RFTC model is a useful way for estimating populations of otters, as well as making the census easier. The method has a lot of potential advantages compared to those widely used for studying otters: i) it provides a reliable approximation of the otter populations in different environments; ii) it corrects the potential biases due to a lack of visual sightings (Walsh et al., 2009) by considering only the surface of the area watched, and not assuming that the probability of detection is always equal; iii) it is a cost-effective technique that does not require the help of a high number of personnel (sometimes inexperienced); and iv) the most interesting and outstanding aspect of the RFTC, as appears in the analysis, is that it is possible to take independent samples, in time and space, of the area of interest by the same researcher. Last but not least, the density estimate compares well with the actual status. These properties are not so clearly defined in the alternative methods for censusing otter populations. Spraint-based analysis, probably including molecular scatology, has numerous faults and/or it costs too much, nearly €60 / $80.40 and around 12 hours/person of work for each spraint, including those that do not give positive results (Mason and Macdonald, 1986, 1987; Kruuk et al., 1986; Kruuk and Conroy, 1987; Kruuk, 1992, 1995, 2006; Reuther et al., 2002; Chanin, 2003; Hung et al., 2004; Waits and Paetkau, 2005; Garcia et al., 2006; Kalz et al., 2006; Prigioni et al., 2006a; Arrendal et al., 2007; Gallant et al., 2007; Gruber et al., 2008; Hájková et al., 2008; Lanzski et al., 2008; Roberts et al., 2008). Snow and sand/mud tracking can fail in particular situations (probably corrected by increasing and improving the quality of the sample and the robustness of statistical analysis; Ruiz-Olmo et al., 2001; Sidorovich and Macdonald, 2001; Chanin, 2003; Stephens et al., 2006; Arrendal et al., 2007; Sulkava, 2007; Sulkava and Liukko, 2007; García, 2008; Gruber et al., 2008; Hájkova et al., 2008). Visual counts (Ruiz-Olmo, 1995), in spite of enabling researchers to get quality ecological and abundance data (Bravo et al., 1998; Ruiz-Olmo et al., 2001; Saavedra, 2002), need a large number of observers (at least 20 people for 10 km of river) during several hours, without any guarantee of success. These drawbacks seem to be, at least partially, removed when applying the RFTC formula. The major constraint of the RFTC method, shared with direct census (Ruiz-Olmo, 1995; Ruiz-Olmo et al., 2001; Saavedra, 2002), is its dependence on diurnal activity of otters. Otters are mainly nocturnal, but in the Mediterranean basin the activity pattern contains a certain degree of daylight movements (Ruiz-Olmo, 1995; Ruiz-Olmo et al., 2001; Saavedra, 2002), making counts possible. Perhaps this does not happen in all populations (but see Kruuk and Moorhouse, 1991; Kruuk, 1995, 2006), and it is advisable to carry out a pilot study in advance of the main fieldwork, to evaluate the presence of dusk and dawn activity. Increasing the number of visits to a sampling site will improve the precision of the results. As demonstrated by our results, the RFTC equation appears to constitute a valuable option for estimating otter populations. However, it should be pointed out that this is only an initial check of this model for this specific goal, and our sample size is small. Indeed, more calibrations are needed in otter populations of known size (Wilson et al., 1996; Wilson and Delahay, 2001). Some provisional data in other localities in central Spain tend to confirm the present observations (own data). We strongly encourage to further tests of the RFTC effectiveness, improving its efficiency and correcting faults, as well as exposing its robustness (Wilson et al., 1996; Wilson and Delahay, 2001; Long et al., 2008). Specially, one needs to acquire insights into its precision and biasses when using independent samples at given time intervals (Stanley and Royle, 2005). If necessary, further factors (e.g., correction coefficients for the diurnal activity, or for the time intervals of sampling; Stanley and Royle, 2005) and changes may be usefully introduced in the formula. It is also possible that the method becomes an option for other otter species with daylight activity (Kruuk, 2006), and in marine populations of the Eurasian otter (Kruuk and Moorhouse, 1991; Yoxon, 2003). AKNOWLEDGEMENTS - Thanks to L. Pérez, D. Díaz, P. García and C. Ayres for their help and support in various ways. We also want to greatly acknowledge the comments of the reviewer and his help with the English speaking. On 9th April 2009, an otter cub was found dead as a road casualty near to Riolobos reservoir; in the first year that otters bred in the area. It is very probable, as suggested in our results (see also Rouco, 2006, for birds), that the disturbance by fishing people in an area without enough den sites, requires otters to disperse to an adequate site for rearing cubs, because in the area fish are abundant, and therefore not likely to limit numbers of breeding otters, as happens in the Mediterranean basin. As the problems caused by fishing people are a consequence of an unfortunate, debatable decision by the local environmental administration, we want to dedicate this work to the animals inhabiting Riolobos, which are surviving against the odds. REFERENCES Arrendal, J., Vilà,
C., Björklund, M. (2007). Reliability of noninvasive
genetic census of otters compared to field censuses. Conserv.
Genet. 8: 1097-1107. Résumé : Utilisation
des Observations Visuelles pour Estimer la Densité de Population
de la Loutre d'Europe (Lutra lutra): Étude
Préliminaire à l'Aide du Modèle de Rowcliffe
et al. Resumen: Empleo de Observaciones
para Estimar la Densidad Poblacional de la Nutria Paleártica
(Lutra Lutra): una Evaluación Preliminar Utilizando
el Modelo de Rowcliffe et al. |
|||||||||||||||||||||||||||||||
| [Copyright © 2006 - 2050 IUCN/SSC OSG] | [Home] | [Contact Us] |